In one of our recent CraftCMS projects, we encountered a very slow page-speed. This project was for the swiss lifestyle magazine Friday. As we to implemented more and more articles on our testing platform, we discovered that the database queries grew exponential 📈. The loading time went up to several seconds and we knew, that we have to tackle this as soon as possible. So we started to investigate our template code. Here is a quick guide of how to tackle performance issues with CraftCMS.
Yii Debug Toolbar
First you need to enable the debugger toolbar. In Craft you can debug your templates with the build-in Yii Debug Toolbar. This toolbar provides you with valuable information about the database queries executed by the page. You can filter or sort all queries to see which one takes more time than expected.
The Yii Debug Toolbar is a configurable set of panels that display various debug information about the current request/response and when clicked, displays more details about the panel’s content.
Enable Debugger Toolbar
11th August UPDATE: The awesome nystudio107 told me, that you don’t have to be in devMode. So you can skip this part
To enable the debugger toolbar, you first need to enable devMode in your config/general.php.
  return array(
    'devMode' => true,
  );
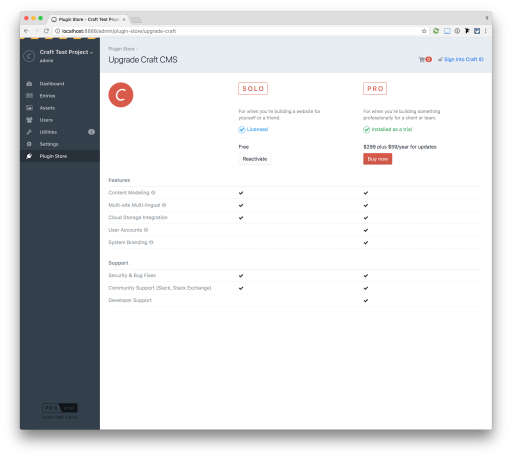
After that, go to your admin panel and click on the bottom left corner on the craft licence link. This will open up the licence overview. In order to enable the debugger toolbar, you need to have the full version of CraftCMS. There are 2 options:
- You buy it
- You run it locally or on a test environment. Here is how
In the admin panel, click on the top left corner and open up your profile. Check if you have admin permission. Then go to preferences tab and enable both checkboxes. Now you will see a small toolbar in the bottom right corner. Click on it to see more details.
Debugging your page
For debugging the page-speed, the most important information in the debugger toolbar are:
- Time. Shows you how long the website takes to load and after what time the browser ist able to fetch all assets (css/js/images/…)
- DB. Shows how many Database queries and the time they need
If you click anywhere in the toolbar, you can see all the details.
Sort by duration is the main feature we are using here. As a quick reminder, we want to identify queries, which take too much time and need some improvements. If you open up the Performance Profiling window, you can identify which part of the template takes the longest.
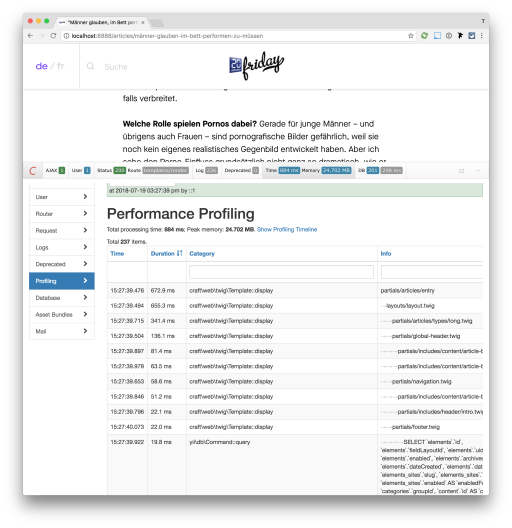
If you split up your templates in several different templates, it is easier to determine slow parts in the code. You can see in the image above, that the global-header is part of the layout template. So in this case the layout.twig template is including the partial global-header.twig. You can read more about includes in the Twig Docs
If your code is not split up like in the example above or if you need to profile your twig template more in detail, check out the craft-twigprofiler. With this tool you can test smaller chunks of your template.
Reduce database queries with Eager Loading
To keep the database queries as low as possible, you need to bundle the queries into bigger pieces and fetch as many related data as you can at once. In order to tell Craft in advance which data we are going to use, we need to Eager Load them. With Eager Loading, Craft is able to return related elements. Like this Craft fetches sub-elements in advance instead of doing the same query for every sub-element over and over again.
A relation in craft has a source and a target. The source has a relation field and selects the other element. The target is selected by the source. Relations | Craft 2 Documentation
It’s important to grasp those terms, as they are relevant to the templating side of things
In Craft, elements are:
- Assets
- Categories
- Entries
- Global Sets
- Matrix Blocks
- Tags
- Users
It takes some steps to implement Eager Loading. This example shows you how you Eager Load an imageField:
No Eager Loading
    {% set entries = craft.entries().section('info').all() %}

    {% for entry in entries %}
      {% set image = entry.imageField.one()%}
      {% if image %}
        <img src="{{ image.url }}" alt="{{ image.title }}">
      {% endif %}
    {% endfor %}
With Eager Loading
    {% set
      entries = craft.entries()
      .section('info') // 1. fetch entries from info section
      .with(['imageField']) // 2. what should be Eager Loaded?
      .all()
    %}

    {% for entry in entries %}
      {% set image = entry.imageField[0] %} // 3. fetch the image
      {% if image %}
        <img src="{{ image.url }}" alt="{{ image.title }}">
      {% endif %}
    {% endfor %}
There are 2 major things you will notice:
- While selecting all entries from a section (
info), you need to tell Craft, which fields you are going to use. In this case, we will need theimageField. Please note, that this can be a comma separated list (Array syntax) and you can have more than one field here. - We also need to change the image selector from
.one()to[0]
With Eager Loading, no matter how many entries you have to fetch, Craft only needs 3 database queries instead of N+1 (N = number of entries + 1 = initial entries query).
- Make sure you also read through the Craft 3 Documentation
- If you want to dive deeper, here is a really good & detailed read about Eager loading.
Project example
To show you how big the impact can be, here is a real word example. We have a category page which has to filter entries from multiple sections: articles, advertorials and blogs. In total there are 150 entries.
Take a look the huge impact Eager Loading has with ‘only’ 150 entries. Without Eager Loading, Craft needs 937 database queries to fetch all the datas. If we tell Craft in advance what we need, it only needs 156 database queries. Check the following example:
No Eager Loading
Template we are using
    {% set articles = craft.entries.section(['articles', 'advertorials', 'blogs']).orderBy('postDate desc').all() %}

    {% for article in articles %}
      ...
    {% endfor %}
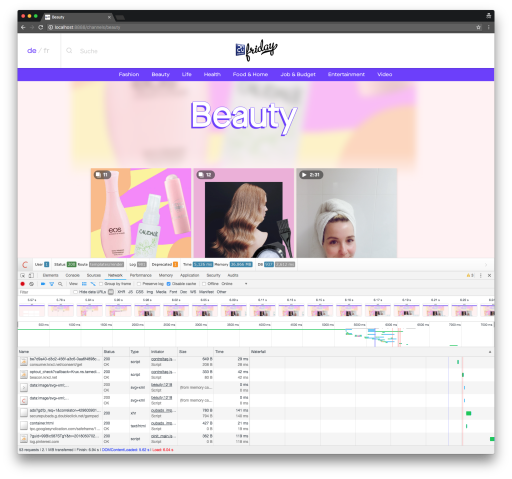
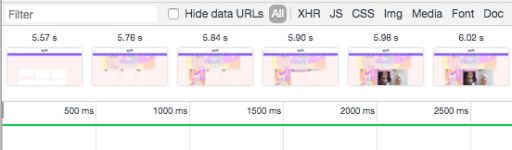
Filmstrip
Sum up
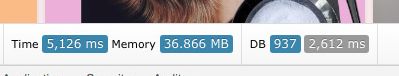
- Database queries: 937
- Time to complete queries: 2.612ms (2.6s !!)
- Website loads after: 5.1s
- First Contentful Paint: at 5.57s
With Eager Loading
Template we are using
    {% set articles = craft.entries.section(['articles', 'advertorials', 'blogs']).orderBy('postDate desc').with([
      'authorPicker', // User
      'backgroundImage', // Asset
      'blogPicker', // Entry
      'displayBlurredForegroundImage', // Asset
      'blogPicker', // Entry
      'categoryOverwrite', // Category
      'categoryPicker', // Category
      'foregroundImage', // Asset
      'imageGalleryPicker', // Entry
      'teaserImage', // Asset
    ]).all() %}

    {% for article in articles %}
      ...
    {% endfor %}
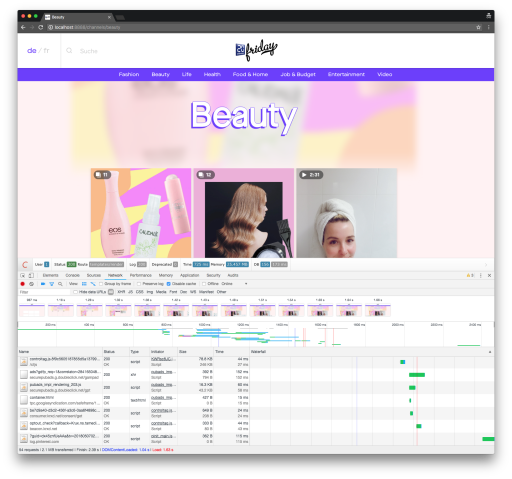
Filmstrip
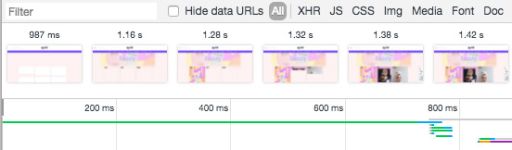
Sum up
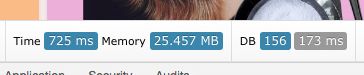
- Database queries: 156
- Time to complete queries: 173ms
- Website loads after: 725ms
- First Contentful Paint at: 987ms
So if you now compare those 2 results, it is very obvious why you should always use Eager Loading.
Conclusion
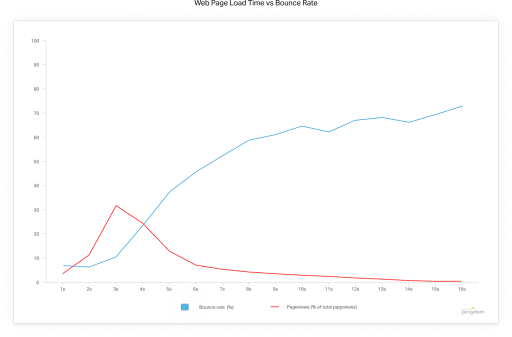
As you saw in the example above, we were able to increase the page-speed by implementing Eager Loading by more than 4 seconds. Our First Contentful Paint (FCP) was after that below 1s (without caching). Looking at the following graph from pingdom, you can see, that it is a good idea to have the First Contentful Paint below 2s. If you are higher than that, does not mean you are serving a bad website, but this means that your user will lose interest very quickly. The bounce rate increases slowly after 2 seconds and rapidly above 3 seconds.
After optimising the template, the next step would be to enable caching. Craft has its build-in caching tag with which you can cache specific parts of your template. The Blitz Plugin is a intelligent static file caching which will improve the FCP even more!
Do not only check your page-speed with the Craft debugger. Also check the network tab in your browser inspector and also use tools like these one:
If you want to know more details, make sure you check out: Profiling your Website with Craft CMS 3’s Debug Toolbar
